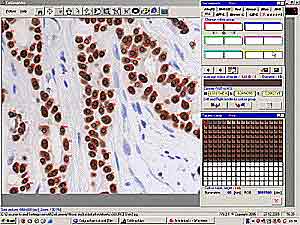
Load
image. Button "Select and move
targets" is active. The
 is seen.
The image size can be modified using
 to fit the screen.
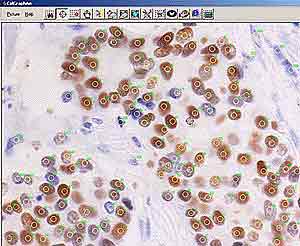
Define targets using right mouse click.
After defining a few, their size and line
colorcan be in place already.
 The target moved using right mouse click (drag and drop)
or cleared (see
).
The target moved using right mouse click (drag and drop)
or cleared (see
).
To establish the first profile try to
define as much targets as possible in
different colors, covering entirely the
staining results from negativity to
positivity.
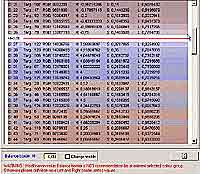
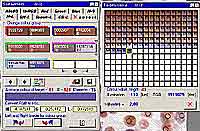
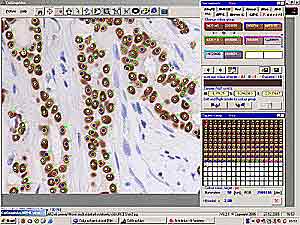
Open tools for color
analysis. Panel "Sort
methods" serves to select and switch
the algorithms of sorting. Panel
"Target colours" shows the
average colors within targets (currently
unsorted).
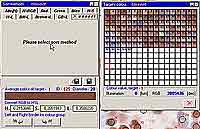
Select sort method. There
are essentially two kinds of sort methods
available: simple and two step. The
simple methods e.g. (red, Green, Blue)
sort targets according to the amount of
the key colour component. In two steps
sorts first a treshold discriminating
between positive and negative staining
(Hue, Brown, BN, GB) is to be estimated.
In the second step Lightness or
Saturation are applied to ensure fine
sorting for semiquantitative assessment.
For this purpose serves the another tool:
Html view. In following example we will
use sort method H+L.
First the sort with default value H=0 is performed
The targets are sorted but
brown color does not appear at one side.
Using Html view we will be able to set
the proper value for H. Balance 0 is not
OK as can be seen here:
If balance is set to 2,0 the discrimination is much better:
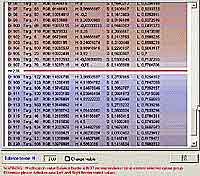
The target colors
sorted this way show the
gradient from dark brown to dark blue:
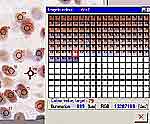
Now the adequacy of
sorting values can be checked using the tool
 enabling to identify the
sorted targets within original image.
enabling to identify the
sorted targets within original image.
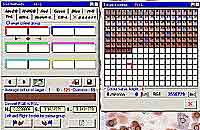
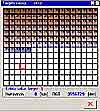
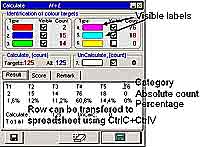
If satisfactory result is
obtained, the next step is to define the
categories of staining in the window
 by clicking appropriate
squares in sorted Target colours. Up to
six categories can be defined. If the
category border is not identical with the
treshold value, such a category is
automatically divided. See an example
with four categories of positivity and
one negative. This is used for histoscore
counting.
by clicking appropriate
squares in sorted Target colours. Up to
six categories can be defined. If the
category border is not identical with the
treshold value, such a category is
automatically divided. See an example
with four categories of positivity and
one negative. This is used for histoscore
counting.
The numbers in lower row
indicate the numbers of squares. The
white label in Targets colour window
indicatees the H treshold value. Now the
targets can be calculated.
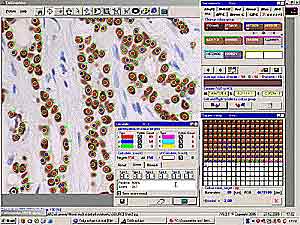
A formula for histoscore
counting can be defined using
"Score". A category is first
defined as positive or negative (double
click) and the the index is defined. In
this case the final score is 0-400. The
formula is 4*percentage of strongest
positivity + 3*percentage of strong
positivity + 2*percentage of weak
positivity + 1*percentage of
borderline positivity (cit.)
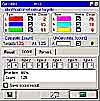
The remarks can be added
and the complete result can be saved
including them.
The defined categories and calculation
rules represent a "Profile" or
"etalon". These are specific
for different sort methods, can be saved
under different names from window "
 " for
different purposes. Furthermore, they can
be modified, but still are backward
compatible as will be shown here:
" for
different purposes. Furthermore, they can
be modified, but still are backward
compatible as will be shown here:
Let us open another image.
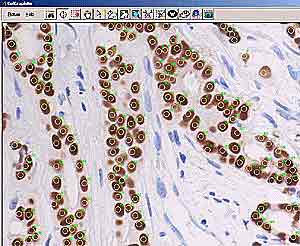
Opening the tools:
Now we open and load the
saved profile (etalon) . The targets are
automatically sorted and after Calculate
also labeled. The white labels mean the
target colour does not fit within a
defined range.
This is to be corrected as
seen below. Note the numbers of targets
appearing now in lower row of color group
labels. After another calculate all
targets are labeled properly.
An
updated profile is to be saved. Usually
after 10 to 20 measurments a definite
profile is set up.


 tool
tool

 are placed (use "Modify number of
random targets" before - the appropriate number is 100-203, depends from image size and shape).
The target size should be smaller (5-8), please modify in
are placed (use "Modify number of
random targets" before - the appropriate number is 100-203, depends from image size and shape).
The target size should be smaller (5-8), please modify in
 Use sort method Red and 2 categories (positive-negative) etalon e.g. Ki67 estimate before. The
percentage of brown area appears in T2 category. Repeat for three images an average the percentage.
This approach can be applied also for more complicated tasks
Use sort method Red and 2 categories (positive-negative) etalon e.g. Ki67 estimate before. The
percentage of brown area appears in T2 category. Repeat for three images an average the percentage.
This approach can be applied also for more complicated tasks